
Đang tải… / Loading…
Đang tải… / Loading…

A tourism event can look highly successful: big crowds, plenty of booths, a packed meeting schedule and a buzzing atmosphere. For a B2B event, however, those numbers only describe the surface. What matters more is how businesses actually interact with one another: which buyers actively seek out which sellers, which invitations are accepted, which meetings really take place, which markets are interested in which product groups, and which connections begin to show potential to continue after the event.
DITF 2026 is creating the conditions to look at trade activity in exactly that way. With more than 300 sellers, more than 150 international buyers, more than 400 domestic buyers and over 1,500 delegates and visitors, the event is large enough to form a substantial trade network. Yet its deeper value lies not in the number of people who show up over two days, but in the ability to turn every interaction into data that can be read, compared and tracked. DITF then answers not only the question “how many people came?”, but moves closer to questions with greater business value: who is looking for whom, where demand is shifting, and which connections are likely to become real leads?
At a traditional event, the registration list only tells you who is attending. On a B2B platform with pre-matching, invitation data reveals something more important: who wants to meet whom, and why. A Korean buyer who keeps sending invitations to golf, resort and wellness suppliers leaves a very different signal from an Indian buyer focused on weddings or MICE. Conversely, if many sellers actively approach a particular group of buyers, that data also reflects what the supply side expects from that market.
Invitations are therefore more than a technical step in scheduling. They are a form of data on commercial intent. Aggregated by market, product group and business type, invitations can show the Organising Committee where interest is flowing right before the trading days: which groups are drawing attention, which markets are attracting the most interest, and which products buyers are searching for more than expected.
This is a layer of insight that a headline figure such as “150 international buyers attended” simply cannot capture.
An invitation only expresses interest from one side. When it is accepted and becomes a confirmed meeting, both parties have seen enough reason to give each other their time. This is a key transition, because it signals an initial fit between supply and demand.
The invitation-to-meeting ratio can therefore become a telling indicator of matching quality. If a group of sellers sends a great many invitations but few are accepted by buyers, the cause may be profiles that are not clear enough, products that do not match demand, or an approach that is too broad. Conversely, if a category has a high confirmation rate, it signals that market demand and supply capability are meeting quite clearly.
Meeting data thus does more than support scheduling. It helps assess the accuracy of connections. In a network of hundreds of buyers and sellers, it is a way to distinguish between “many touches” and “touches with a reason”.
A confirmed meeting is not guaranteed to take place. Buyers may reschedule, sellers may arrive late, the two sides may miss each other, or changes may arise on the event day itself. That is why looking only at the total number of meetings created in the system does not fully reflect B2B effectiveness.
Completion data clarifies the final status of each appointment: invitation sent, slot accepted, meeting scheduled and meeting actually completed. This is essential if DITF wants to measure effectiveness by real behaviour rather than merely by the plan in the system.
A high completion rate shows that the schedule was well organised, participants were disciplined and coordination was effective enough to minimise gaps. If completion is low, the Organising Committee can review operational bottlenecks such as an overly dense schedule, poorly planned distances between tables, a high no-show rate, or matching that was not compelling enough for both sides to prioritise the meeting.
Completion is therefore both an operational indicator and a measure of the real quality of the trade network.
Check-in is often regarded as a basic event KPI, but in a structured B2B system it can offer far more than confirming how many people are present. When check-in data is combined with appointment schedules and meeting status, the Organising Committee can see which buyers have arrived, which sellers are active, who still has many open slots and which appointments are at risk of being missed.
This opens the door to real-time coordination. A buyer who has checked in but has few meetings can be suggested additional suitable sellers. A seller whose appointment has just been cancelled can be connected with another buyer if the system detects a sufficiently high level of compatibility. Check-in then stops being logistics data and becomes an operational signal for maximising the value of every hour of trading.
This is also a key step in helping DITF move from managing attendance to managing the quality of actual participation.
The number of buyers from each country only tells you the market mix. Market interest is what reveals what each market is actually looking for.
If Korean buyers focus heavily on golf, family and leisure; Indian buyers are interested in weddings and MICE; ASEAN buyers look for short breaks or family trips; and some other markets lean towards wellness or long stays, these signals create a far more specific map of demand than nationality statistics alone.
That data has direct value for sellers. A resort preparing to meet a golf buyer should not pitch the same way it would to a wedding buyer. A DMC targeting the long-stay market will need a completely different product structure from when it works with MICE. When market interest is seen clearly enough, businesses can prepare better in advance, while the Association gains more data to identify which markets need deeper promotion and which demand segments are generating real pull.
This is the point at which event data begins to become data for market strategy.
If market interest answers the question “which market is interested in what?”, category interest lets us ask the reverse: which products are being sought by many markets at once?
This is a highly valuable layer of insight for Da Nang. Golf may not be a story about Korea alone. Wellness may appear across many different visitor segments. Weddings may extend beyond India. MICE may draw simultaneous interest from Northeast Asia, ASEAN and other markets.
When category data is clear enough, businesses will no longer simply chase individual countries. They can identify product groups with cross-market demand and decide to invest more deeply in the capabilities that genuinely have the potential to drive long-term growth.
This is also how trade data can support the destination's product strategy, rather than merely feeding a post-event report.
Invitations indicate intent, meetings show fit, completion confirms the meeting took place. But all of these indicators still only describe the connection journey. The more important layer of data lies after the meeting: has any business signal emerged yet?
A buyer requesting a quotation, a seller being asked to send a proposal, both sides agreeing on a famtrip, a site inspection being scheduled, a MICE inquiry entering negotiation, or a product being added to a 2027 sales plan – all of these can be regarded as lead signals.
These signals are not yet contracts, but they show that networking has begun to turn into a sales pipeline. If DITF can track lead signals after 30 days, 90 days and 6 months, the event will have an entirely different way of measuring itself compared with a model that only tallies people and meetings.
At that point, the question worth asking is no longer “how many meetings were completed?”, but how many meetings led to a next step with commercial value.
One market may have many buyers but a low matching rate. Another may have fewer buyers but a high number of well-matched meetings and lead signals. One category may be mentioned constantly yet rarely turn into proposals, while a smaller product group generates more site inspections or quotation requests.
Looking at attendance alone, these differences all but disappear.
But when invitations, meetings, completion, check-in, market interest, category interest and lead signals are placed side by side, the Organising Committee can start to clearly distinguish what is scale, what is quality and what is conversion potential.
This is a crucial step if DITF wants to be seen as a genuine B2B platform. An event should not be judged only by how many people pass through its gates. It should be judged by how much value is created within its network.
The greatest value of these KPIs lies not in the final report but in their ability to accumulate over many editions. If DITF can track trends year after year, the Association will gradually see which markets are growing in interest, which product groups are emerging, which buyers convert well, which sellers generate leads consistently and which types of connection typically lead to bookings.
Data then no longer serves event operations alone. It becomes a strategic asset for designing a better DITF in future editions: inviting the right buyers, allocating categories more sensibly, building more accurate matching and helping businesses prepare products that more closely fit demand.
This is also how a B2B event can learn from its own history. Each edition does not start again from zero, but is built on the data of the one before.
More than 300 sellers, more than 150 international buyers, more than 400 domestic buyers and over 1,500 attendees give DITF 2026 a notable scale. But scale is only the precondition for trade.
The real value lies in what is harder to see: the invitations sent, the appointments accepted, the meetings that actually take place, the product groups that attract interest and the leads that begin to emerge afterwards.
If these layers of data are captured and tracked properly, DITF will not only know who came. The event can know who looked for whom, who met whom, why they met, and which connections are likely to generate revenue in the future.
Only then does trade data become the true yardstick of a B2B event – and only then does DITF move from organising meetings to understanding, measuring and optimising the quality of every connection it creates.
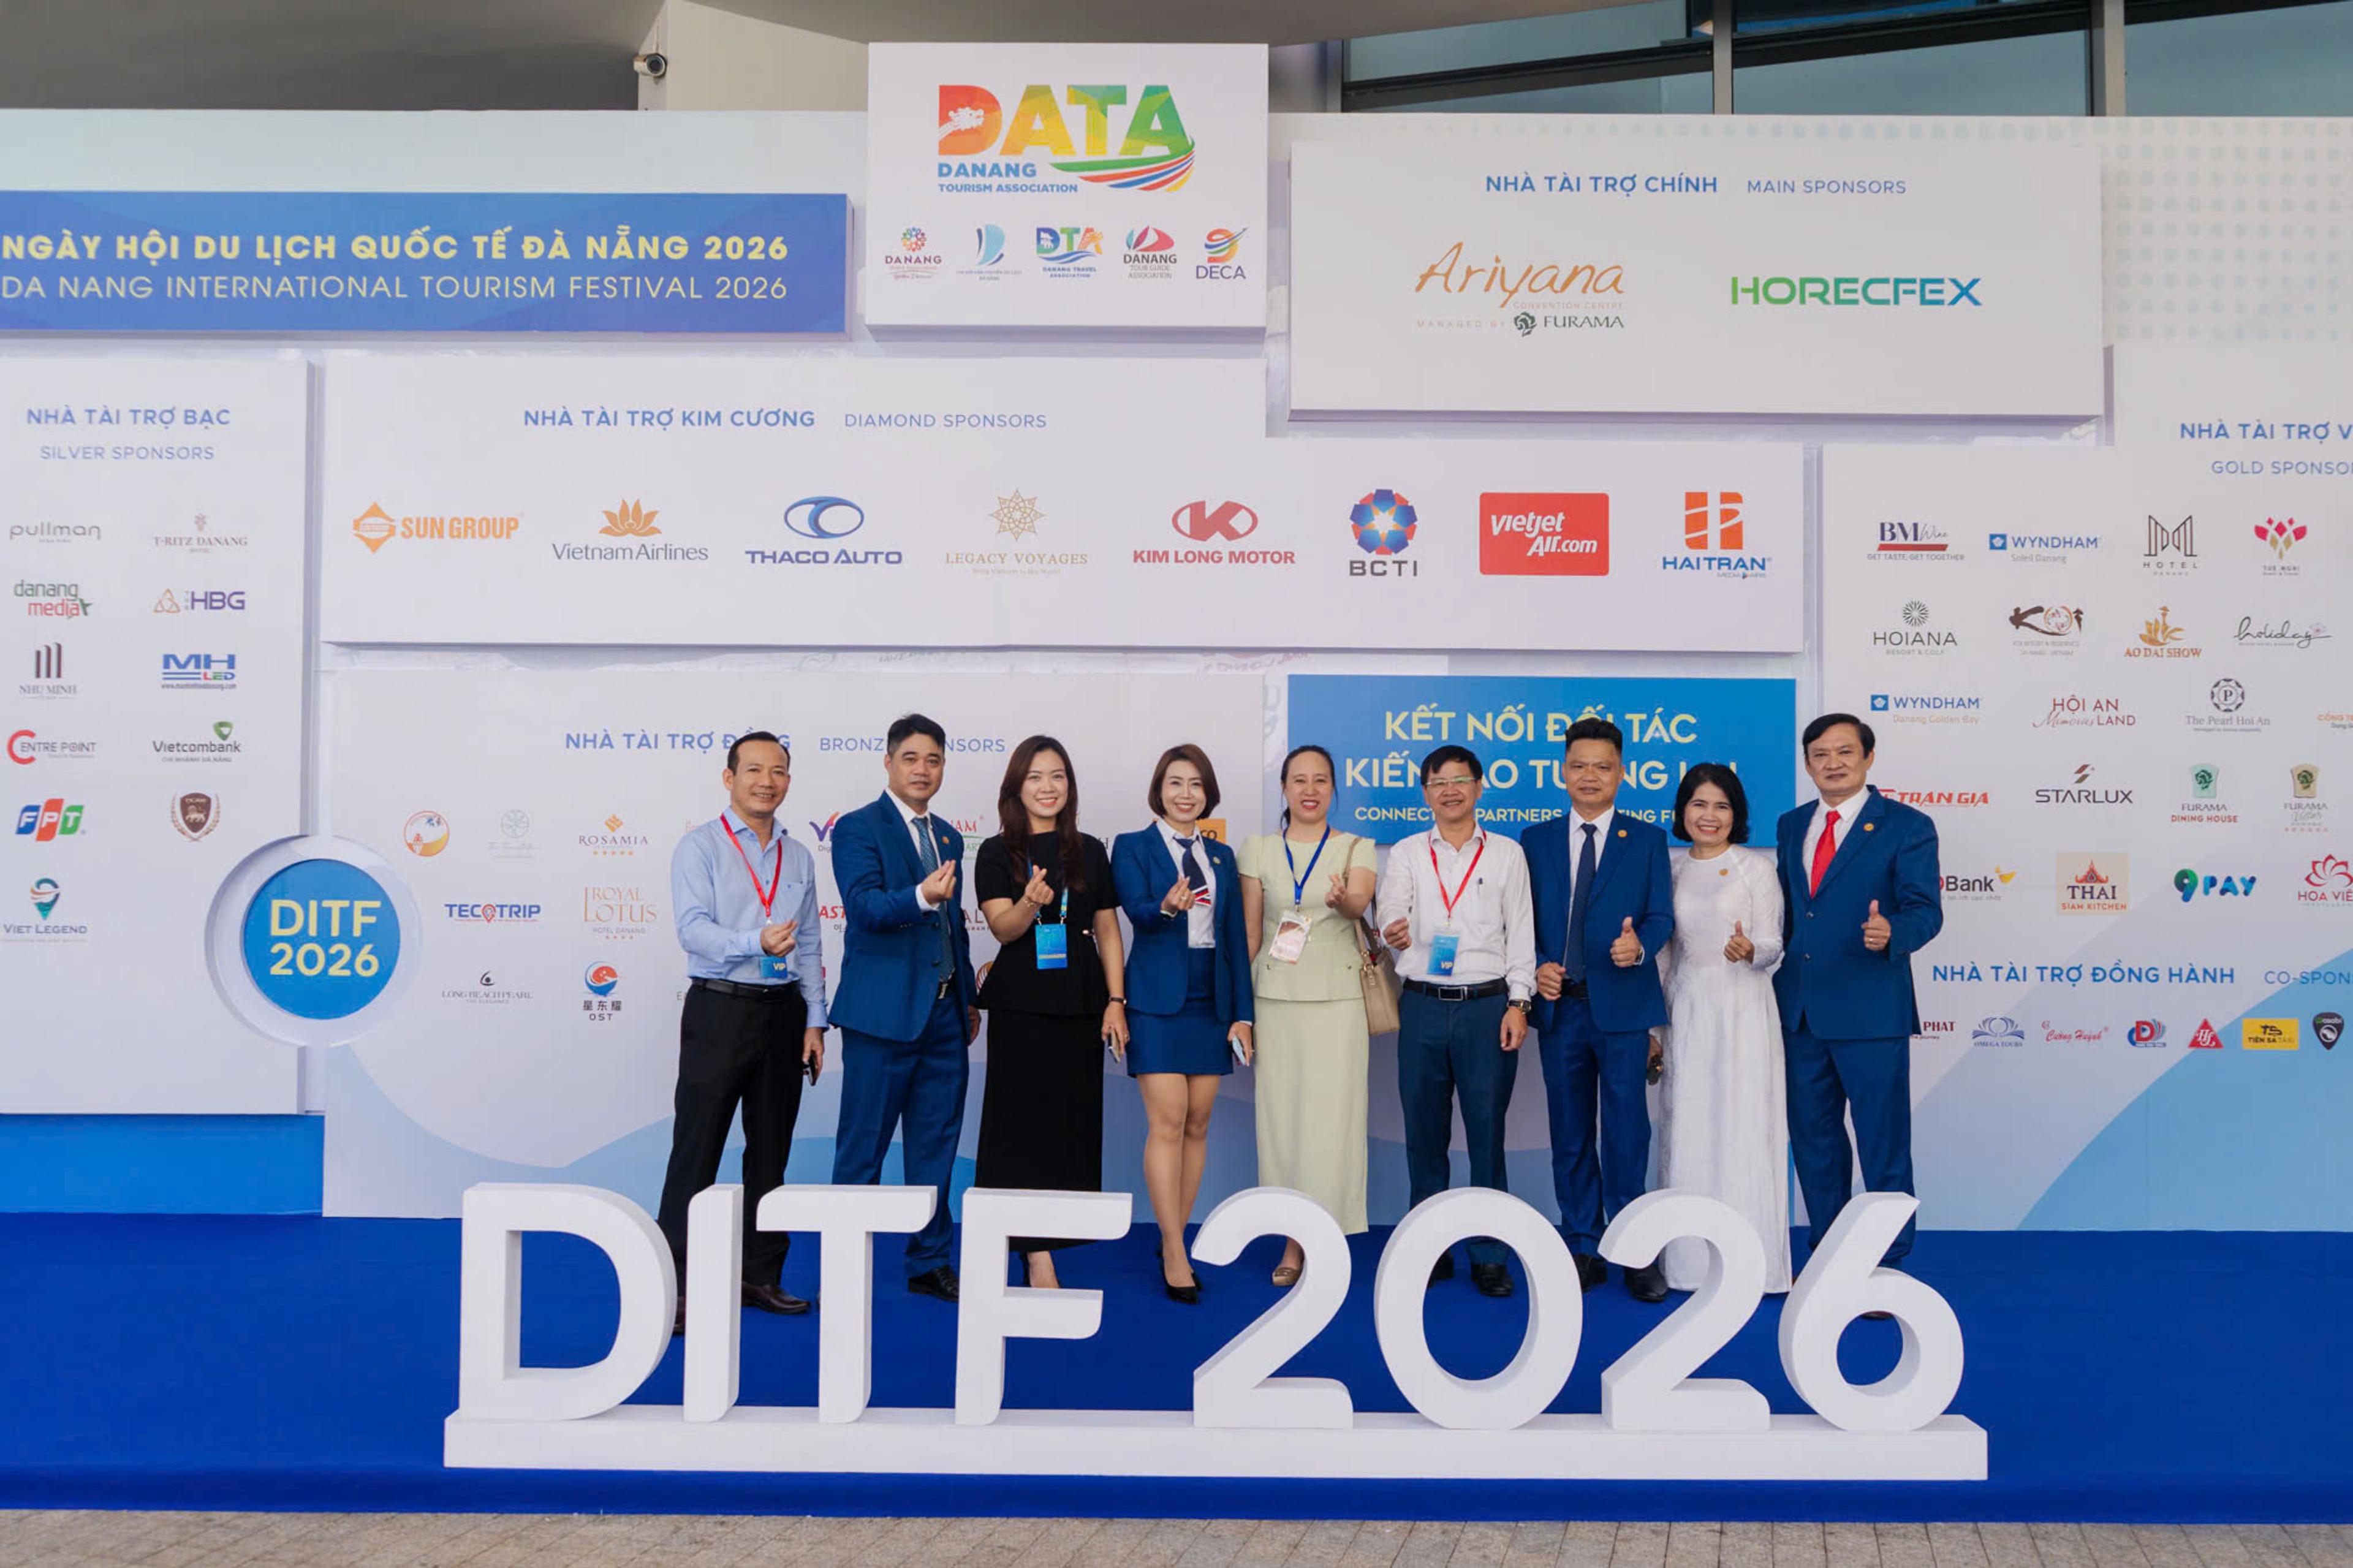
DITF 2026 brings a digital B2B platform into trading: buyers and sellers view profiles, send invitations and fix meetings in advance, making on-site talks more productive.
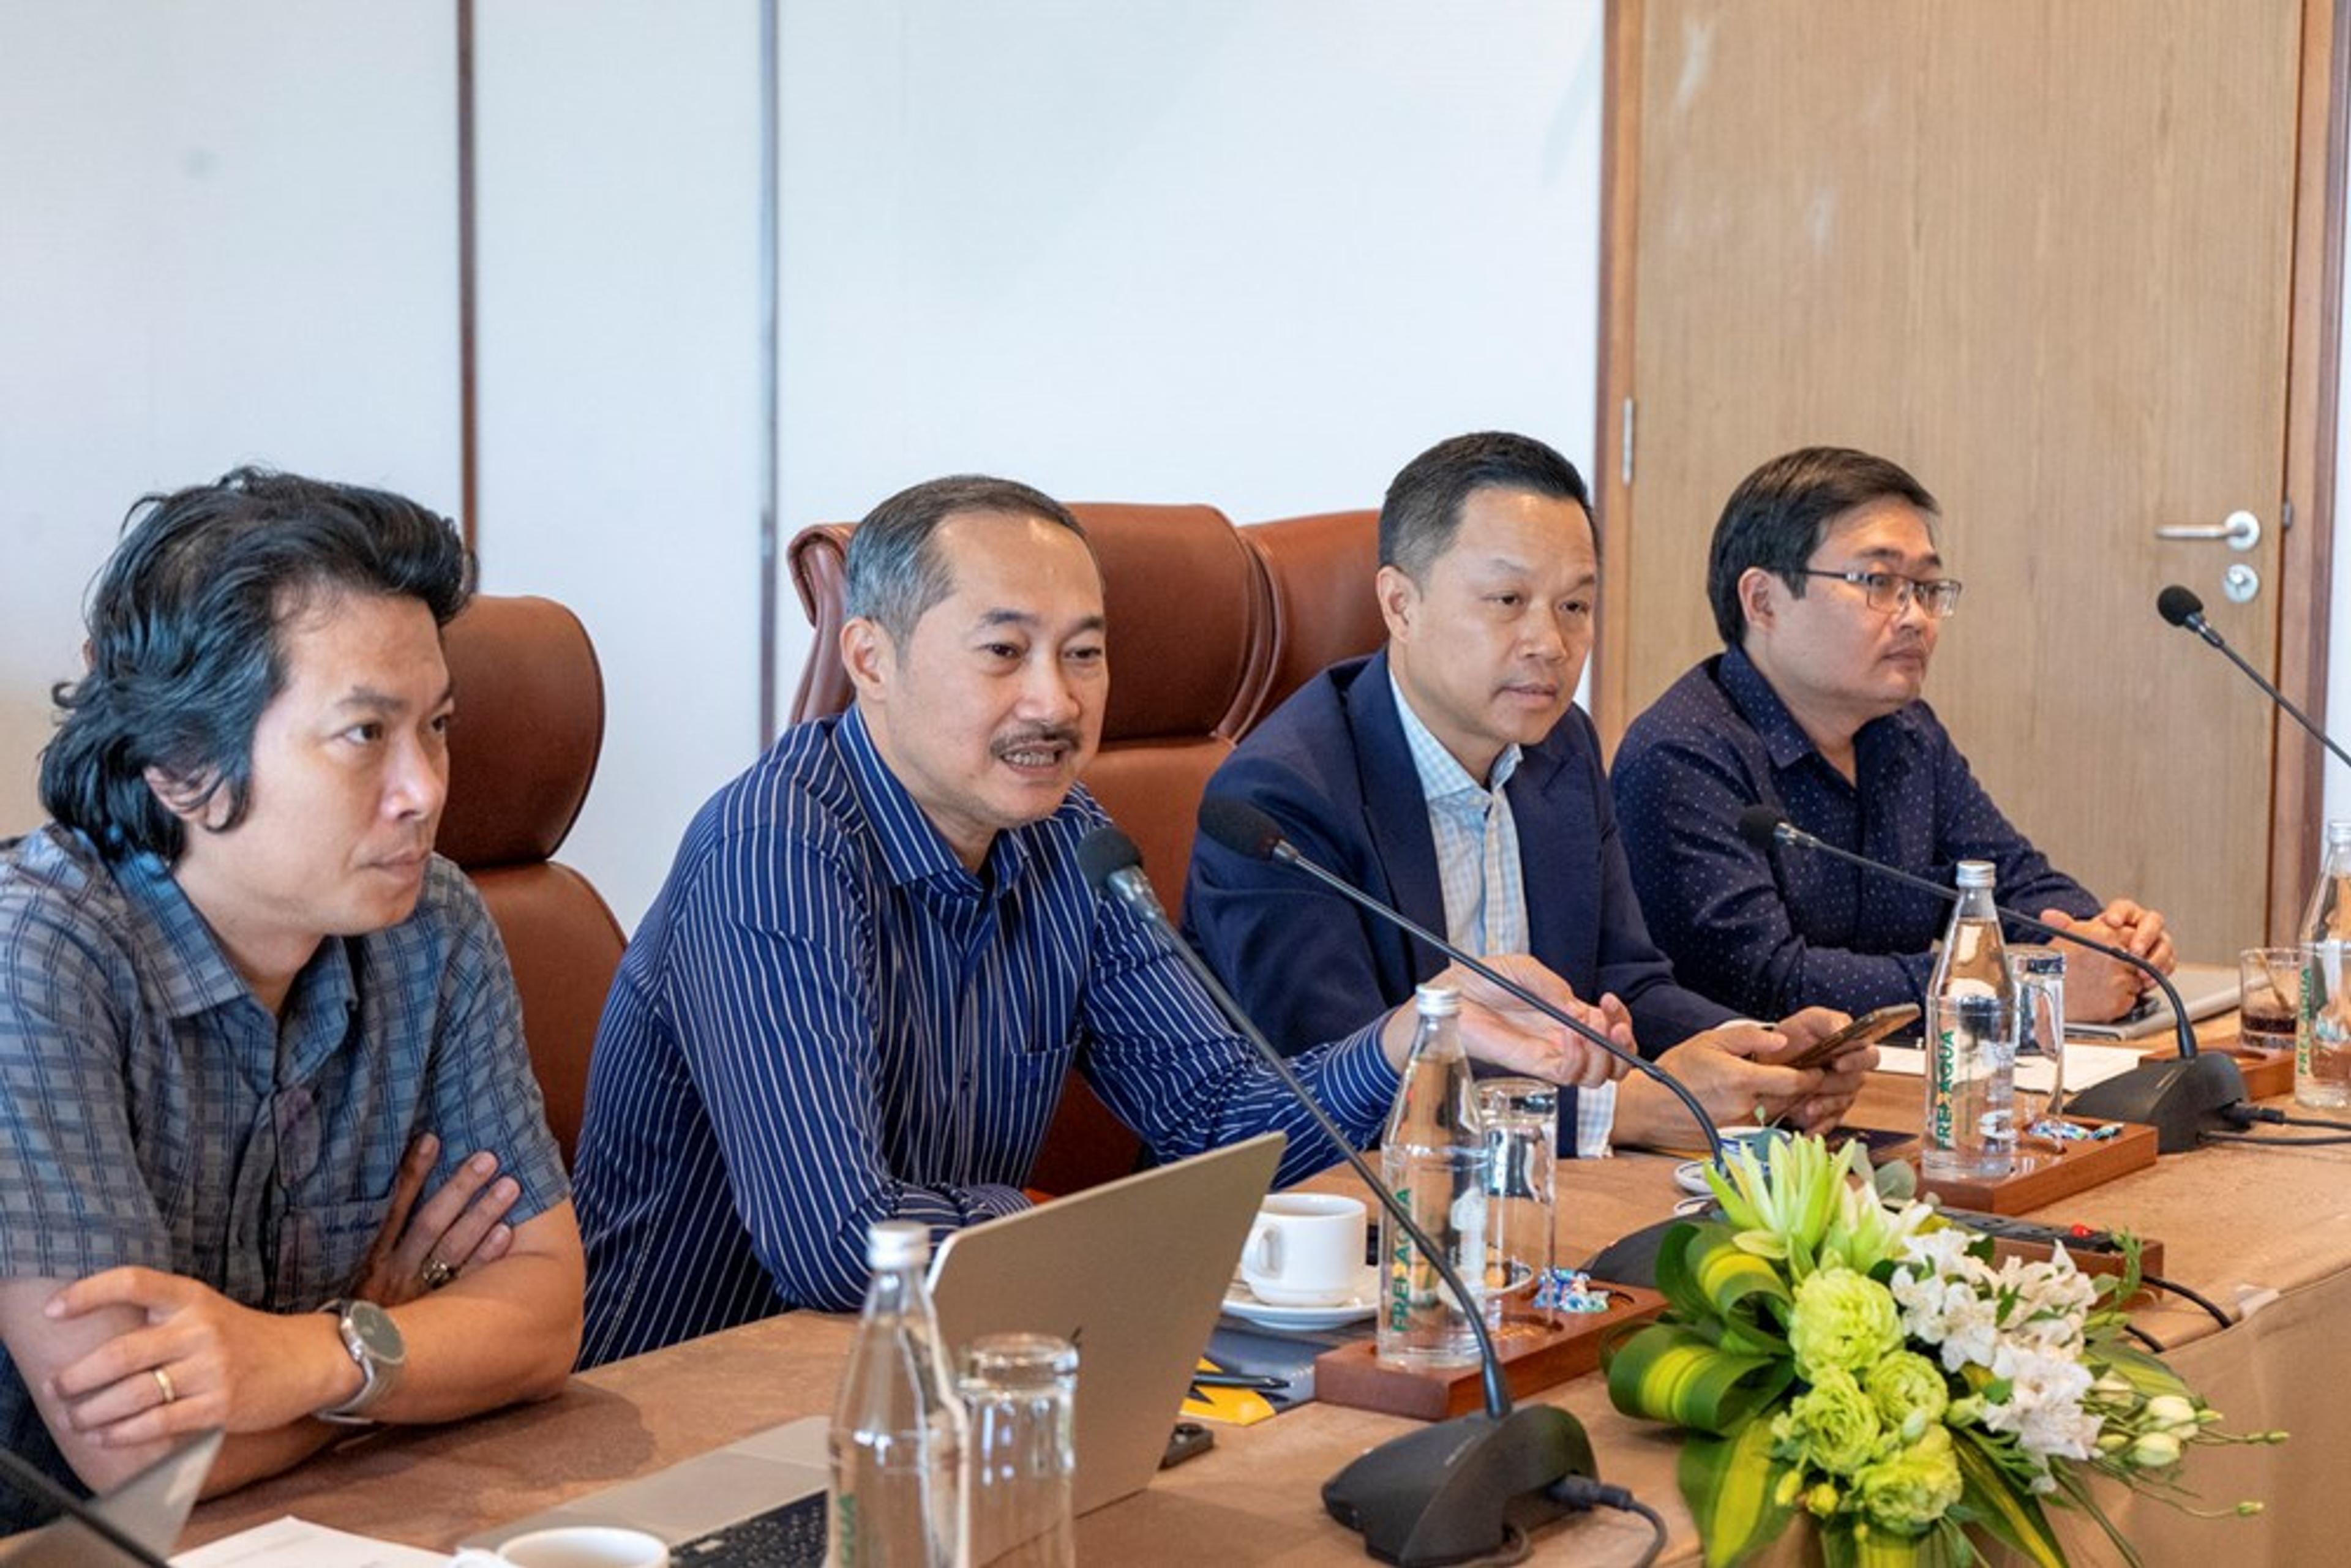
DITF 2026 uses a Pre-scheduled Appointment model: buyers and sellers view profiles, choose partners and confirm meetings before the B2B day.

Nguyen Duc Quynh, General Director of the company that manages Furama Resort Danang, explains how to turn a 10-minute B2B meeting at DITF 2026 into a 2027 contract.